
Changing a chart

To change a chart, press the edit button:
You are then in the edit screen.
Example for an edit screen:
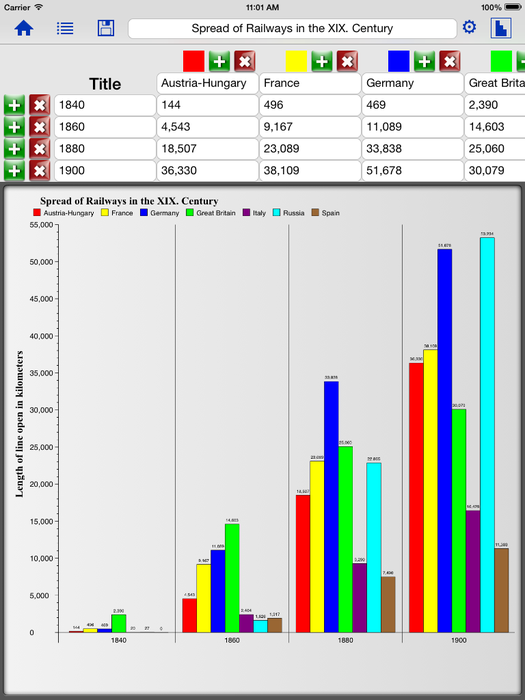
- Editing the header, you can enter and change the chart title (In this example: "Spread of Railwais in the XIX. Century")

- Whith the green "+" button you can add new rows and new columns to the chart data table

- Whith the red "x" button you can delete the rows and columns from the chart data table
- Touching the colored buttons above the table columns, you can change the colours of the chart elements:
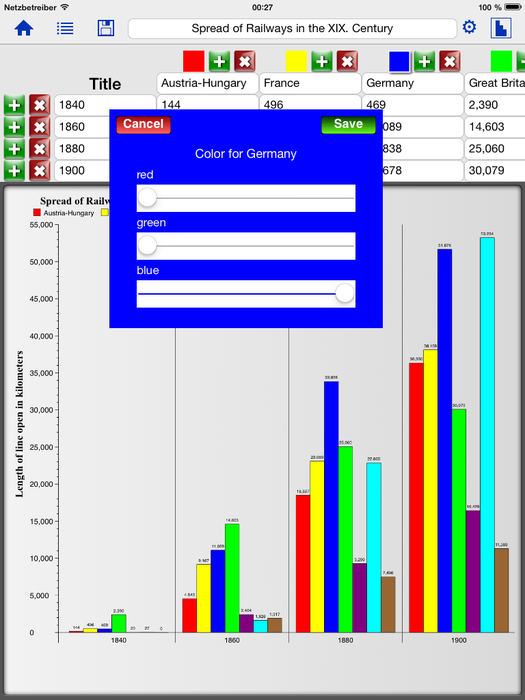
Using the three sliders for red, green and blue, you can select for each column the colour you like.

- Touching the Settings Button, you will come in the settings screen, where you can edit the subtitles of the chart or you can change the chart type:
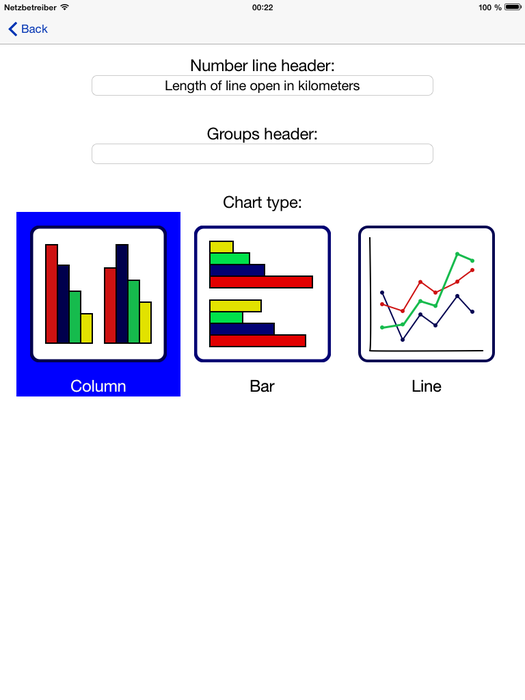 Settings Screen